Adding "flows" into the mix...

You knew it was coming eventually...
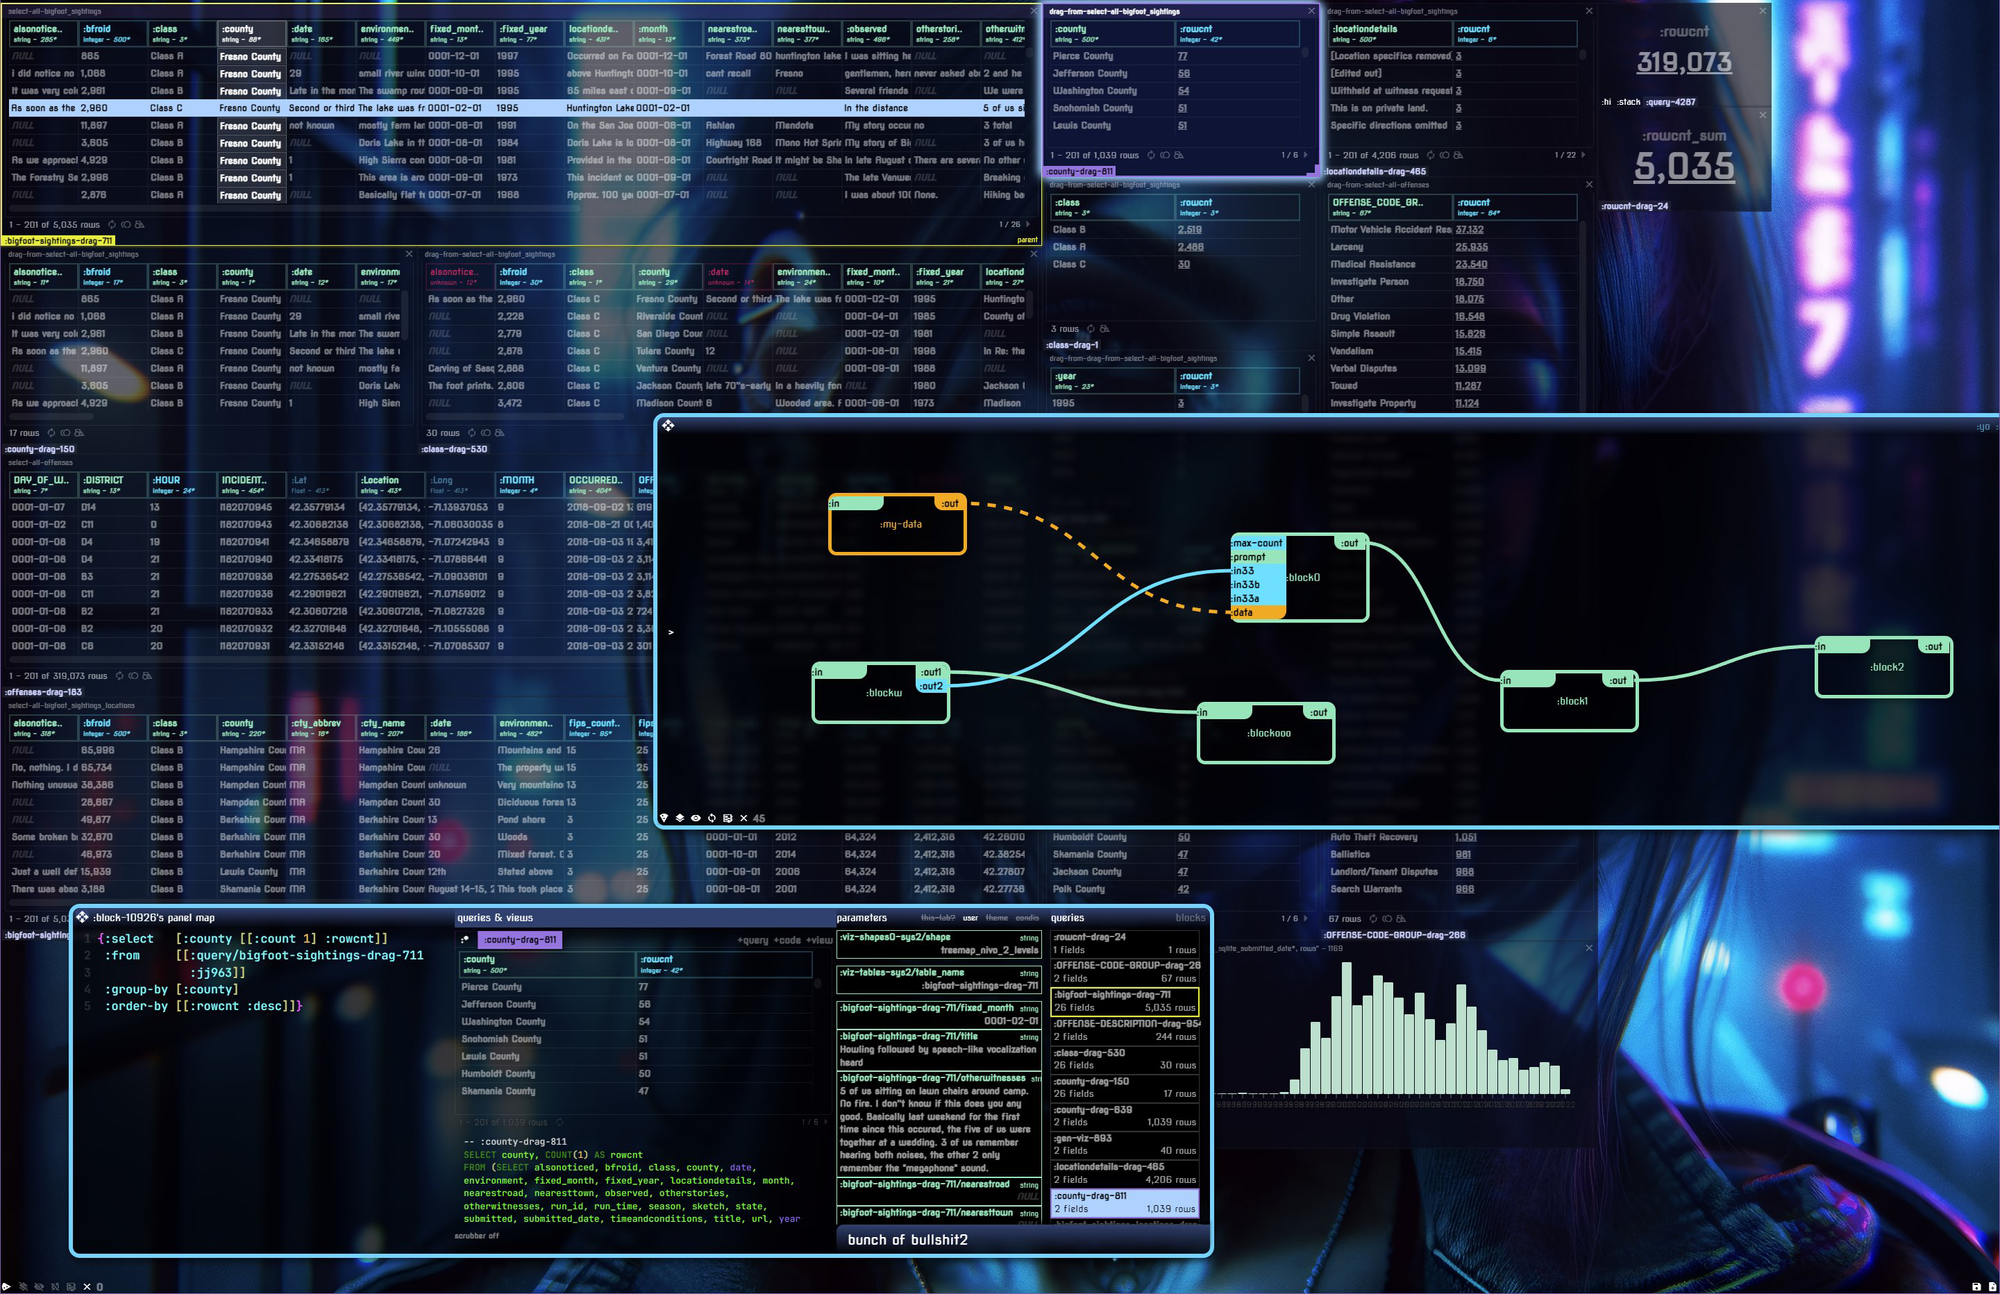
I've been chasing this idea for several years of a "unified" prezi/logic interface (all flow-based), while very cool, it isn't always practical for day to day data work AND prod dashboarding.
Better? A solid prezi/exploration layer with an underlying flow-runner.
A lot to unpack here, but for now - behold the experiments!
"Wouldn't it be cool if I could just drag in & materialize this query from here? What if my dashboard could speak ETL?" pic.twitter.com/JbOMswbezW
— Ryan Robitaille (@ryrobes) December 17, 2023
The spice must flow. pic.twitter.com/Y8SJGvpEm3
— Ryan Robitaille (@ryrobes) December 21, 2023
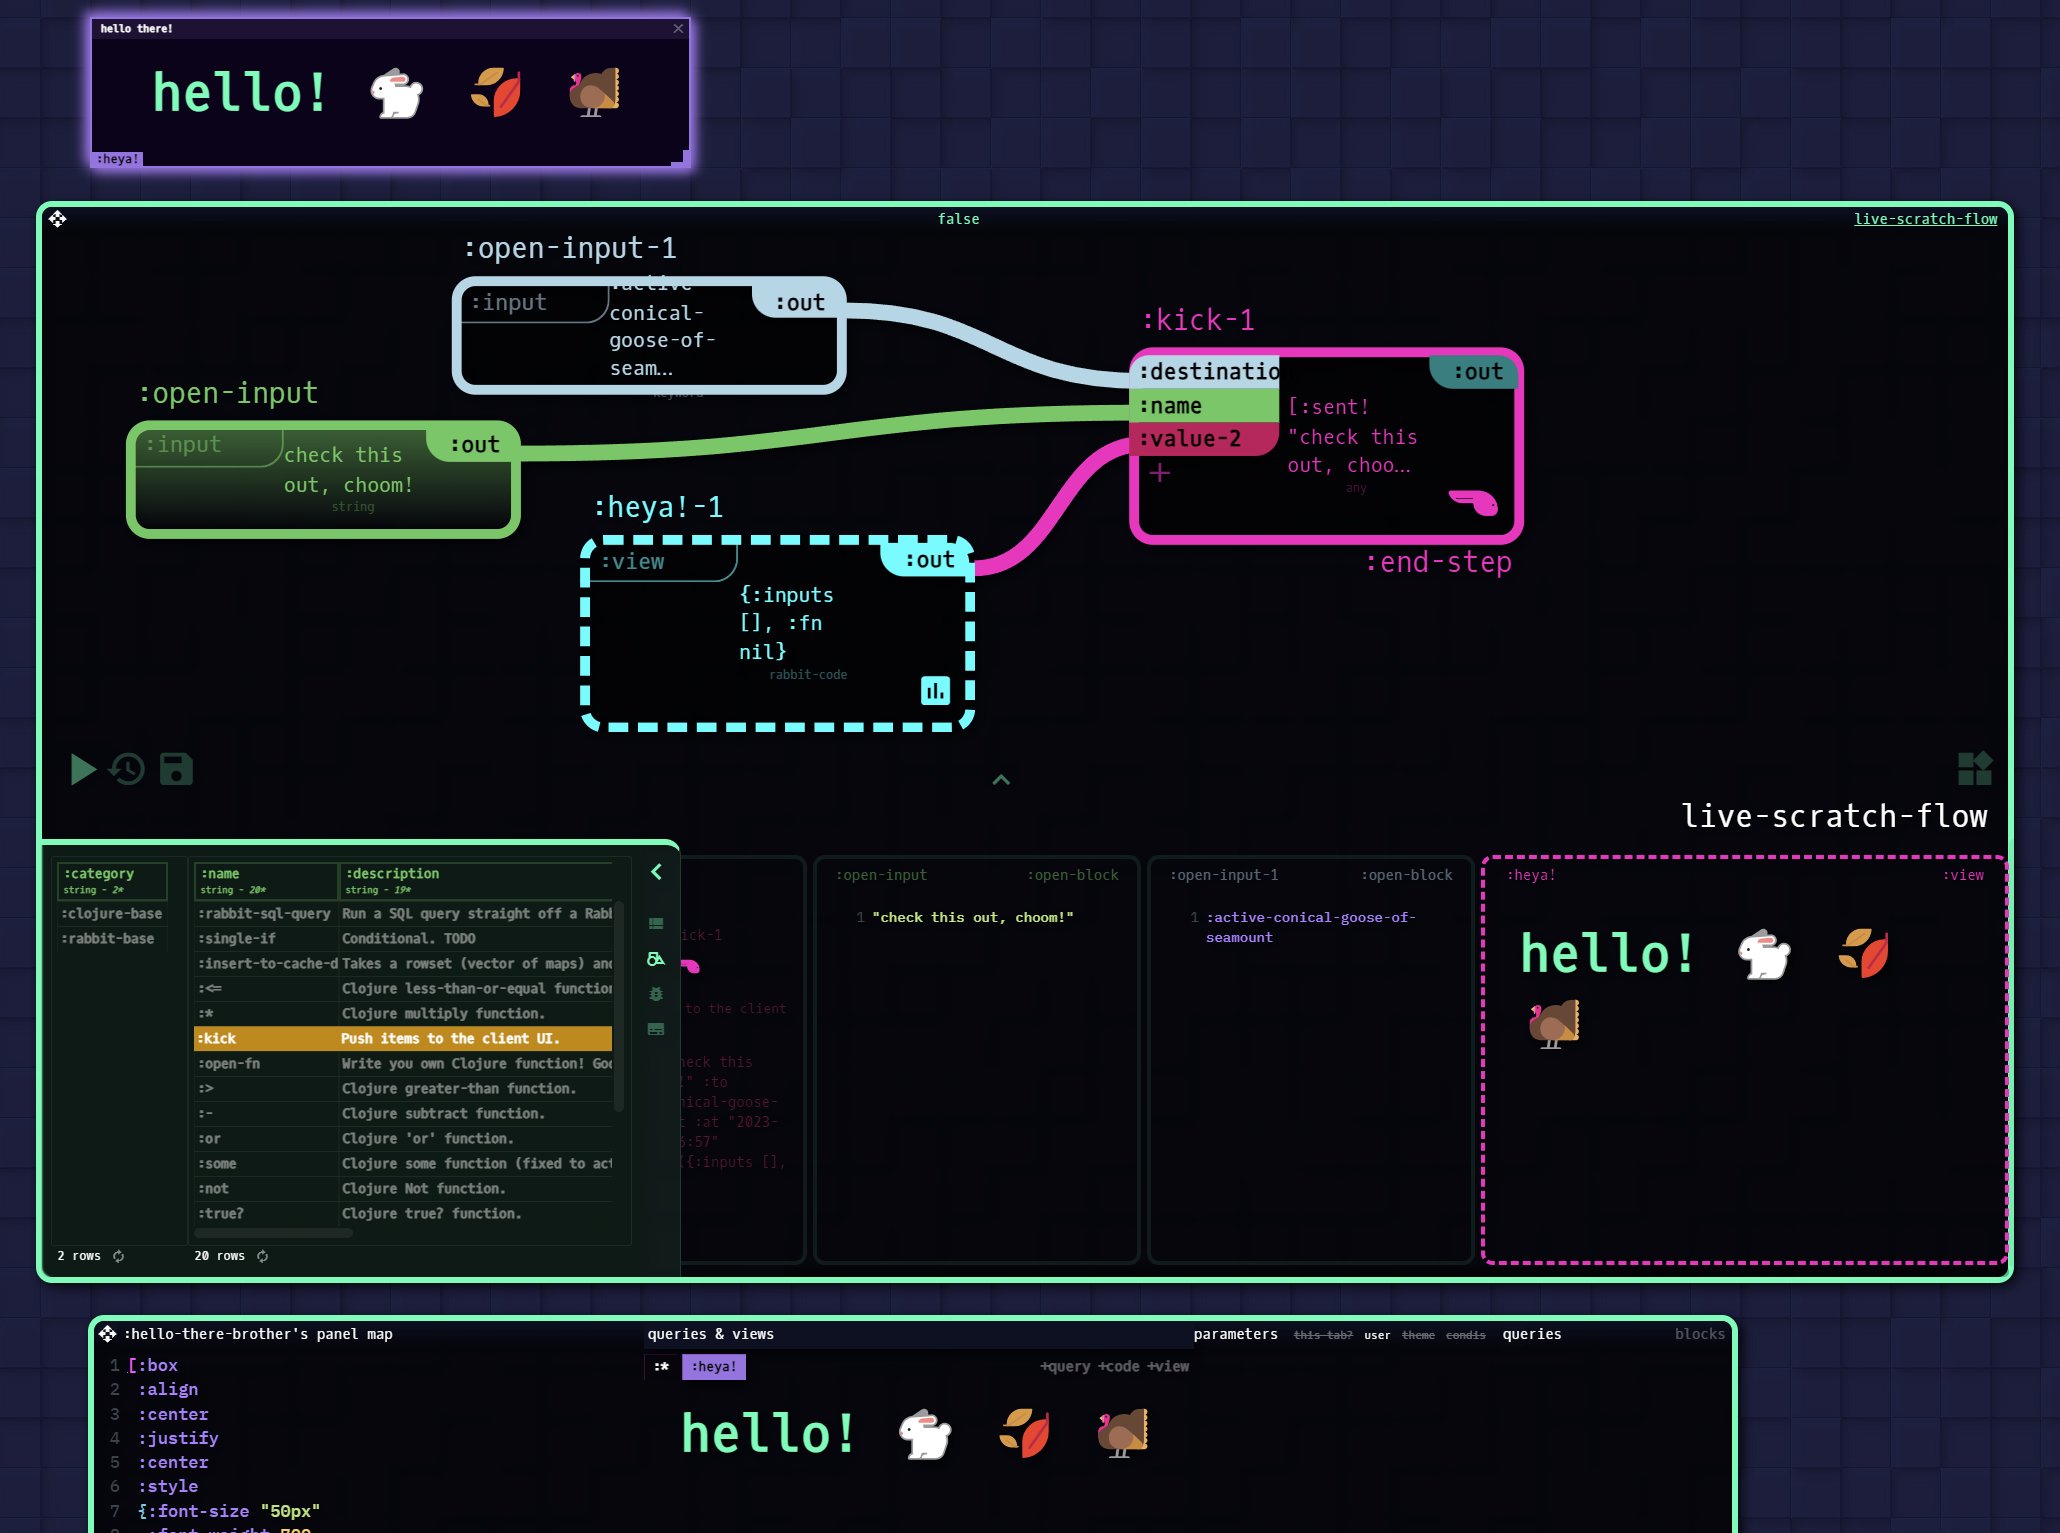
Natural feeling "sub-flows".... Naturally.
Flow things. Drag in to open, drag + F to use as a *component*. Your data "board" is the main focus - but flows are it's 'external circulatory system'.
— Ryan Robitaille (@ryrobes) December 28, 2023
Bonus: if your default settings make it look like an OS from a 1990s hacker movie. pic.twitter.com/AoP3RZrGHW
Flow are also great for integrations - they allow you to "kick" Rabbit content from one client UI to another (or broadcast it team-wide or boomerang back to you) - be it human curated, prog generated, internal LLM pushed, etc.